
Data visualizations - Christmas challenges
Those dataviz were sent to data competitions for some december challenges. Both are made with Tableau Public.
1) Christmas song challenge
Determine Christmas greatest song of all time according to Billboards' charts (US) from 1957 to 2017.
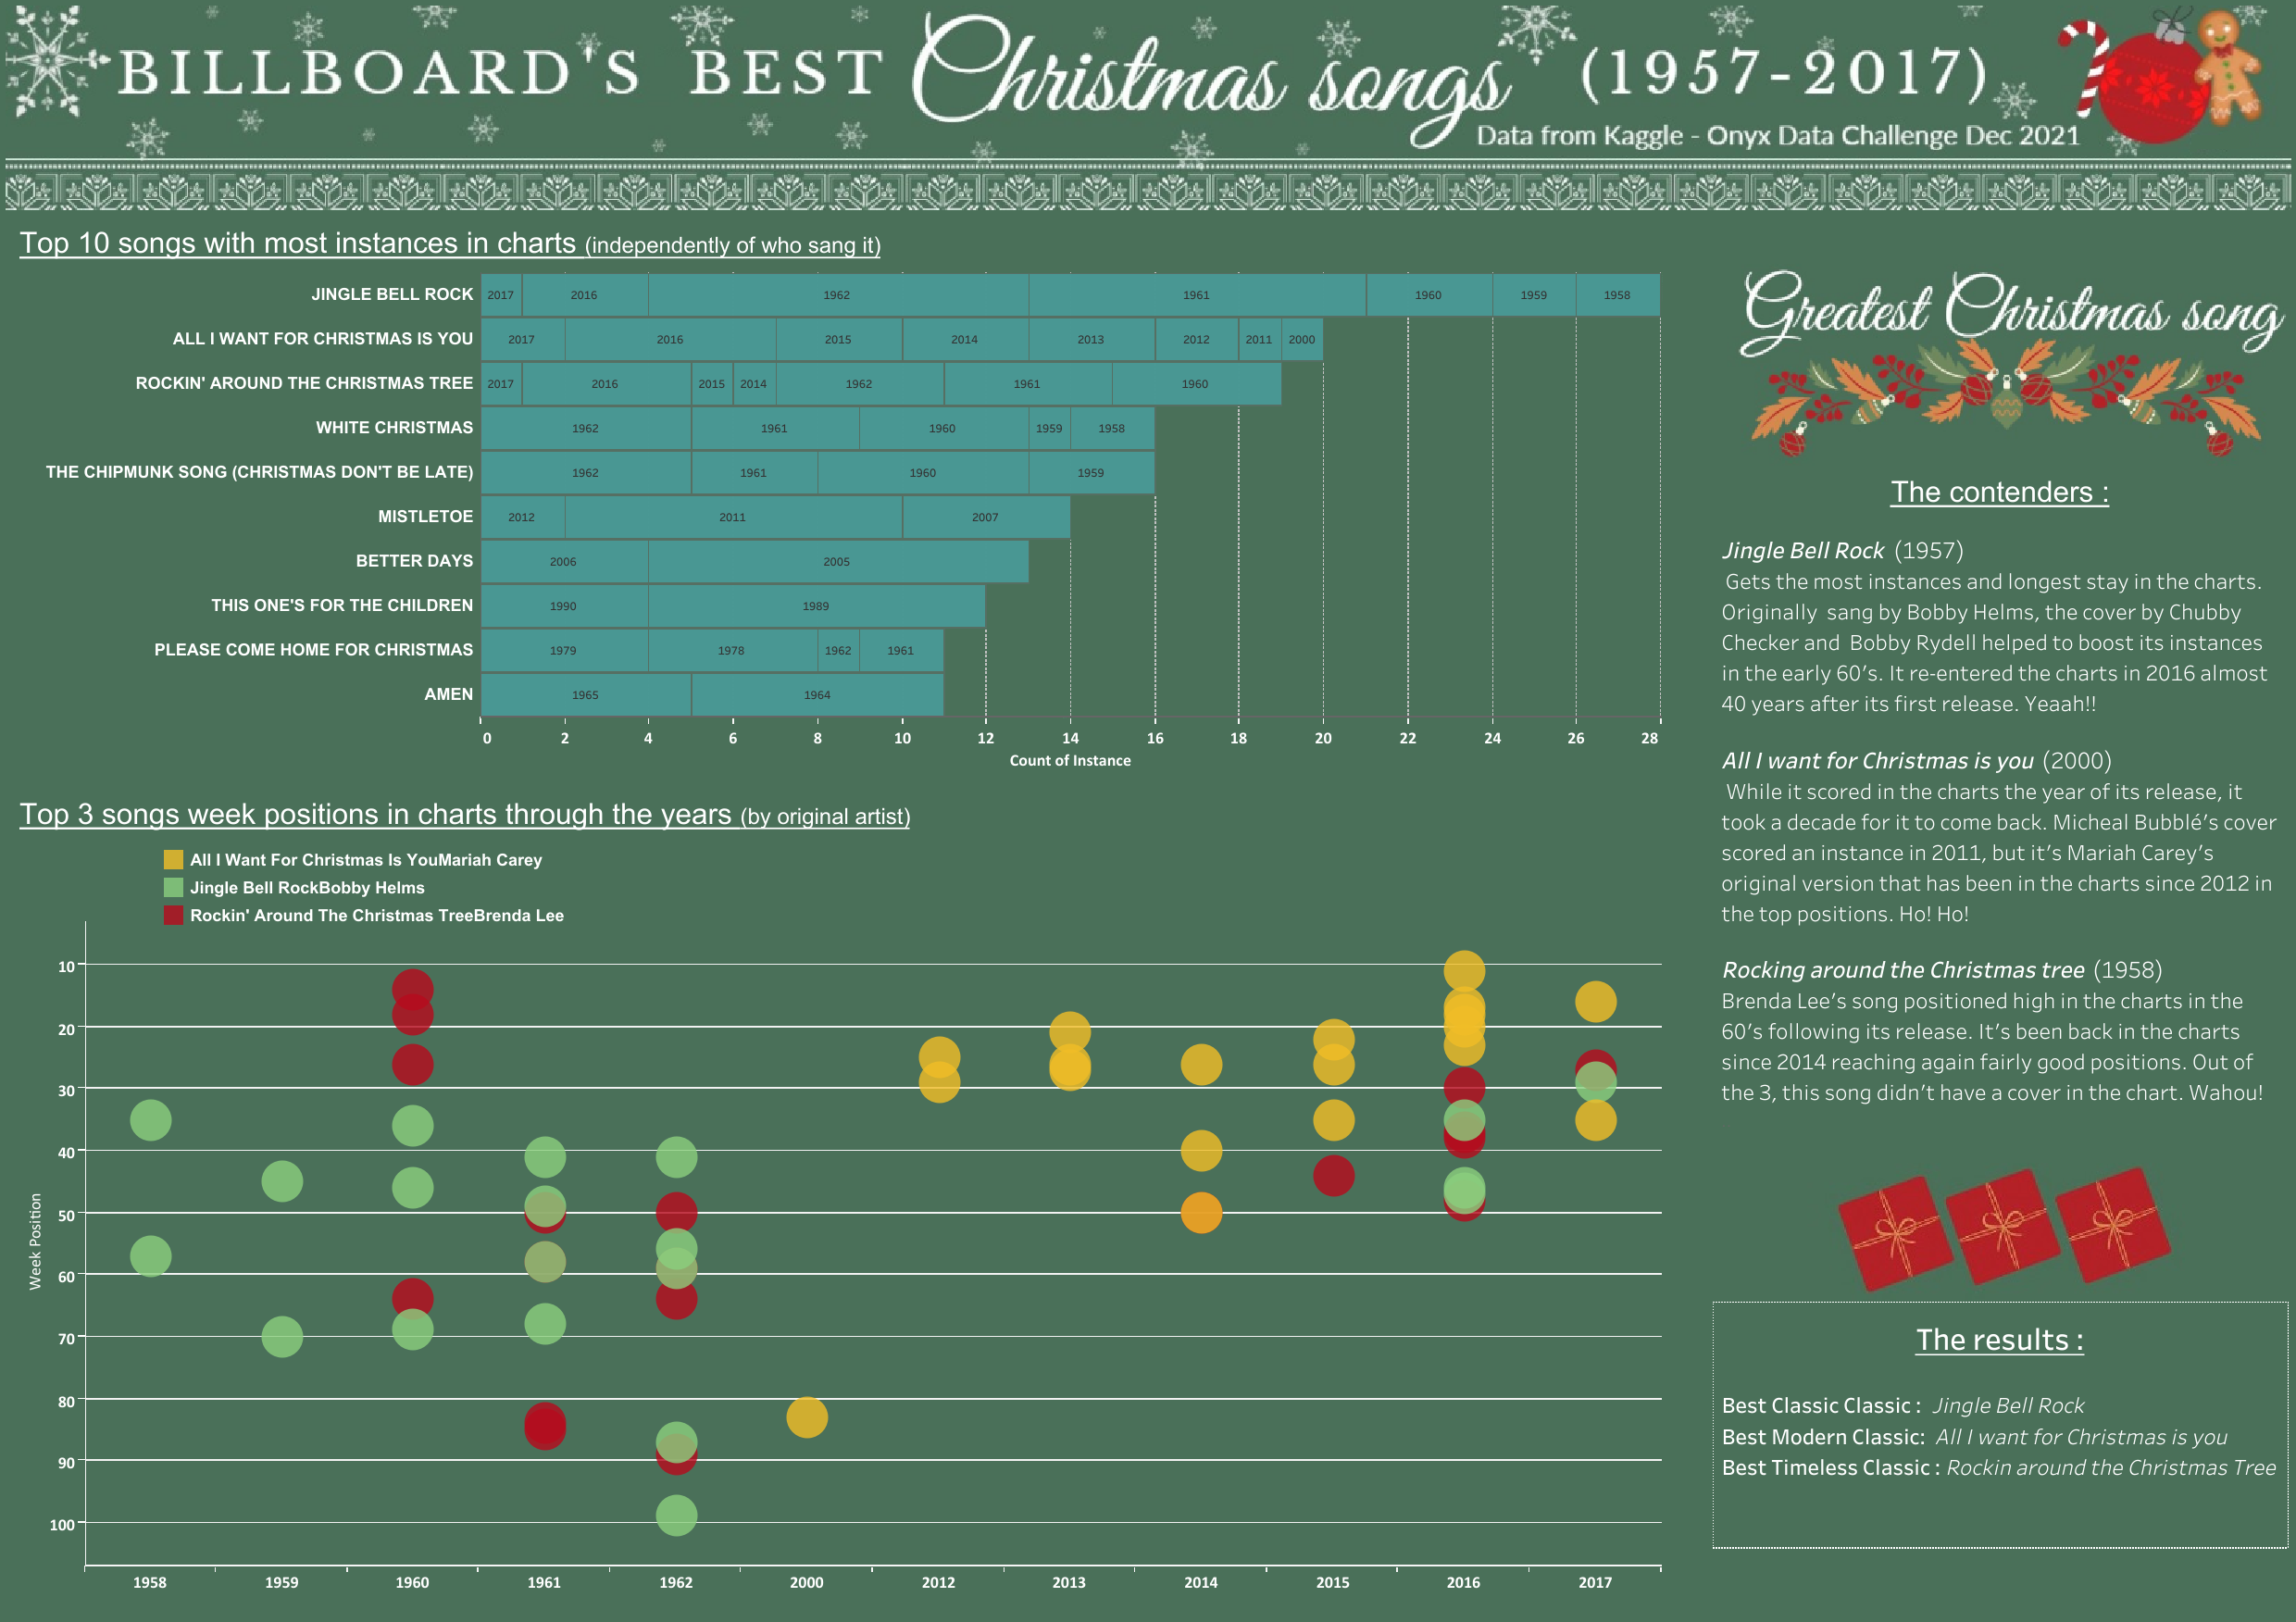
I first focused on the 10 songs that had spent the most time in the charts. I then selected the top 3 to see how they positionned in the charts throughout the years. Out of the 3, two of the songs had covers, so for the second chart I selected the song and its singer. I though it wasn’t fair to compare songs that were written decades appart (technologies, promotions, audiences, sentimentality are too different for each era), so I decided they were all winners in different categories.
And since the main focus was on the best songs, here are some additional informations that didn’t make it to the board but that came from analyzing the dataset: Out of the 387 songs instances, 151 have the word ‘Christmas’ in the title. The best era to release a Xmas song : early 60’s The worst era to release a Xmas song : mid to late 60’s !(and also the mid to late 80’s) The most represented band/singer is the Glee cast with 4 entries. The song with the most entries by different artists is ‘Last Christmas’(3 artists).
2) Celebrating Harry Potter’s movies
Capture the magic of the Harry Potters movies for the 20th anniversary of the first film.
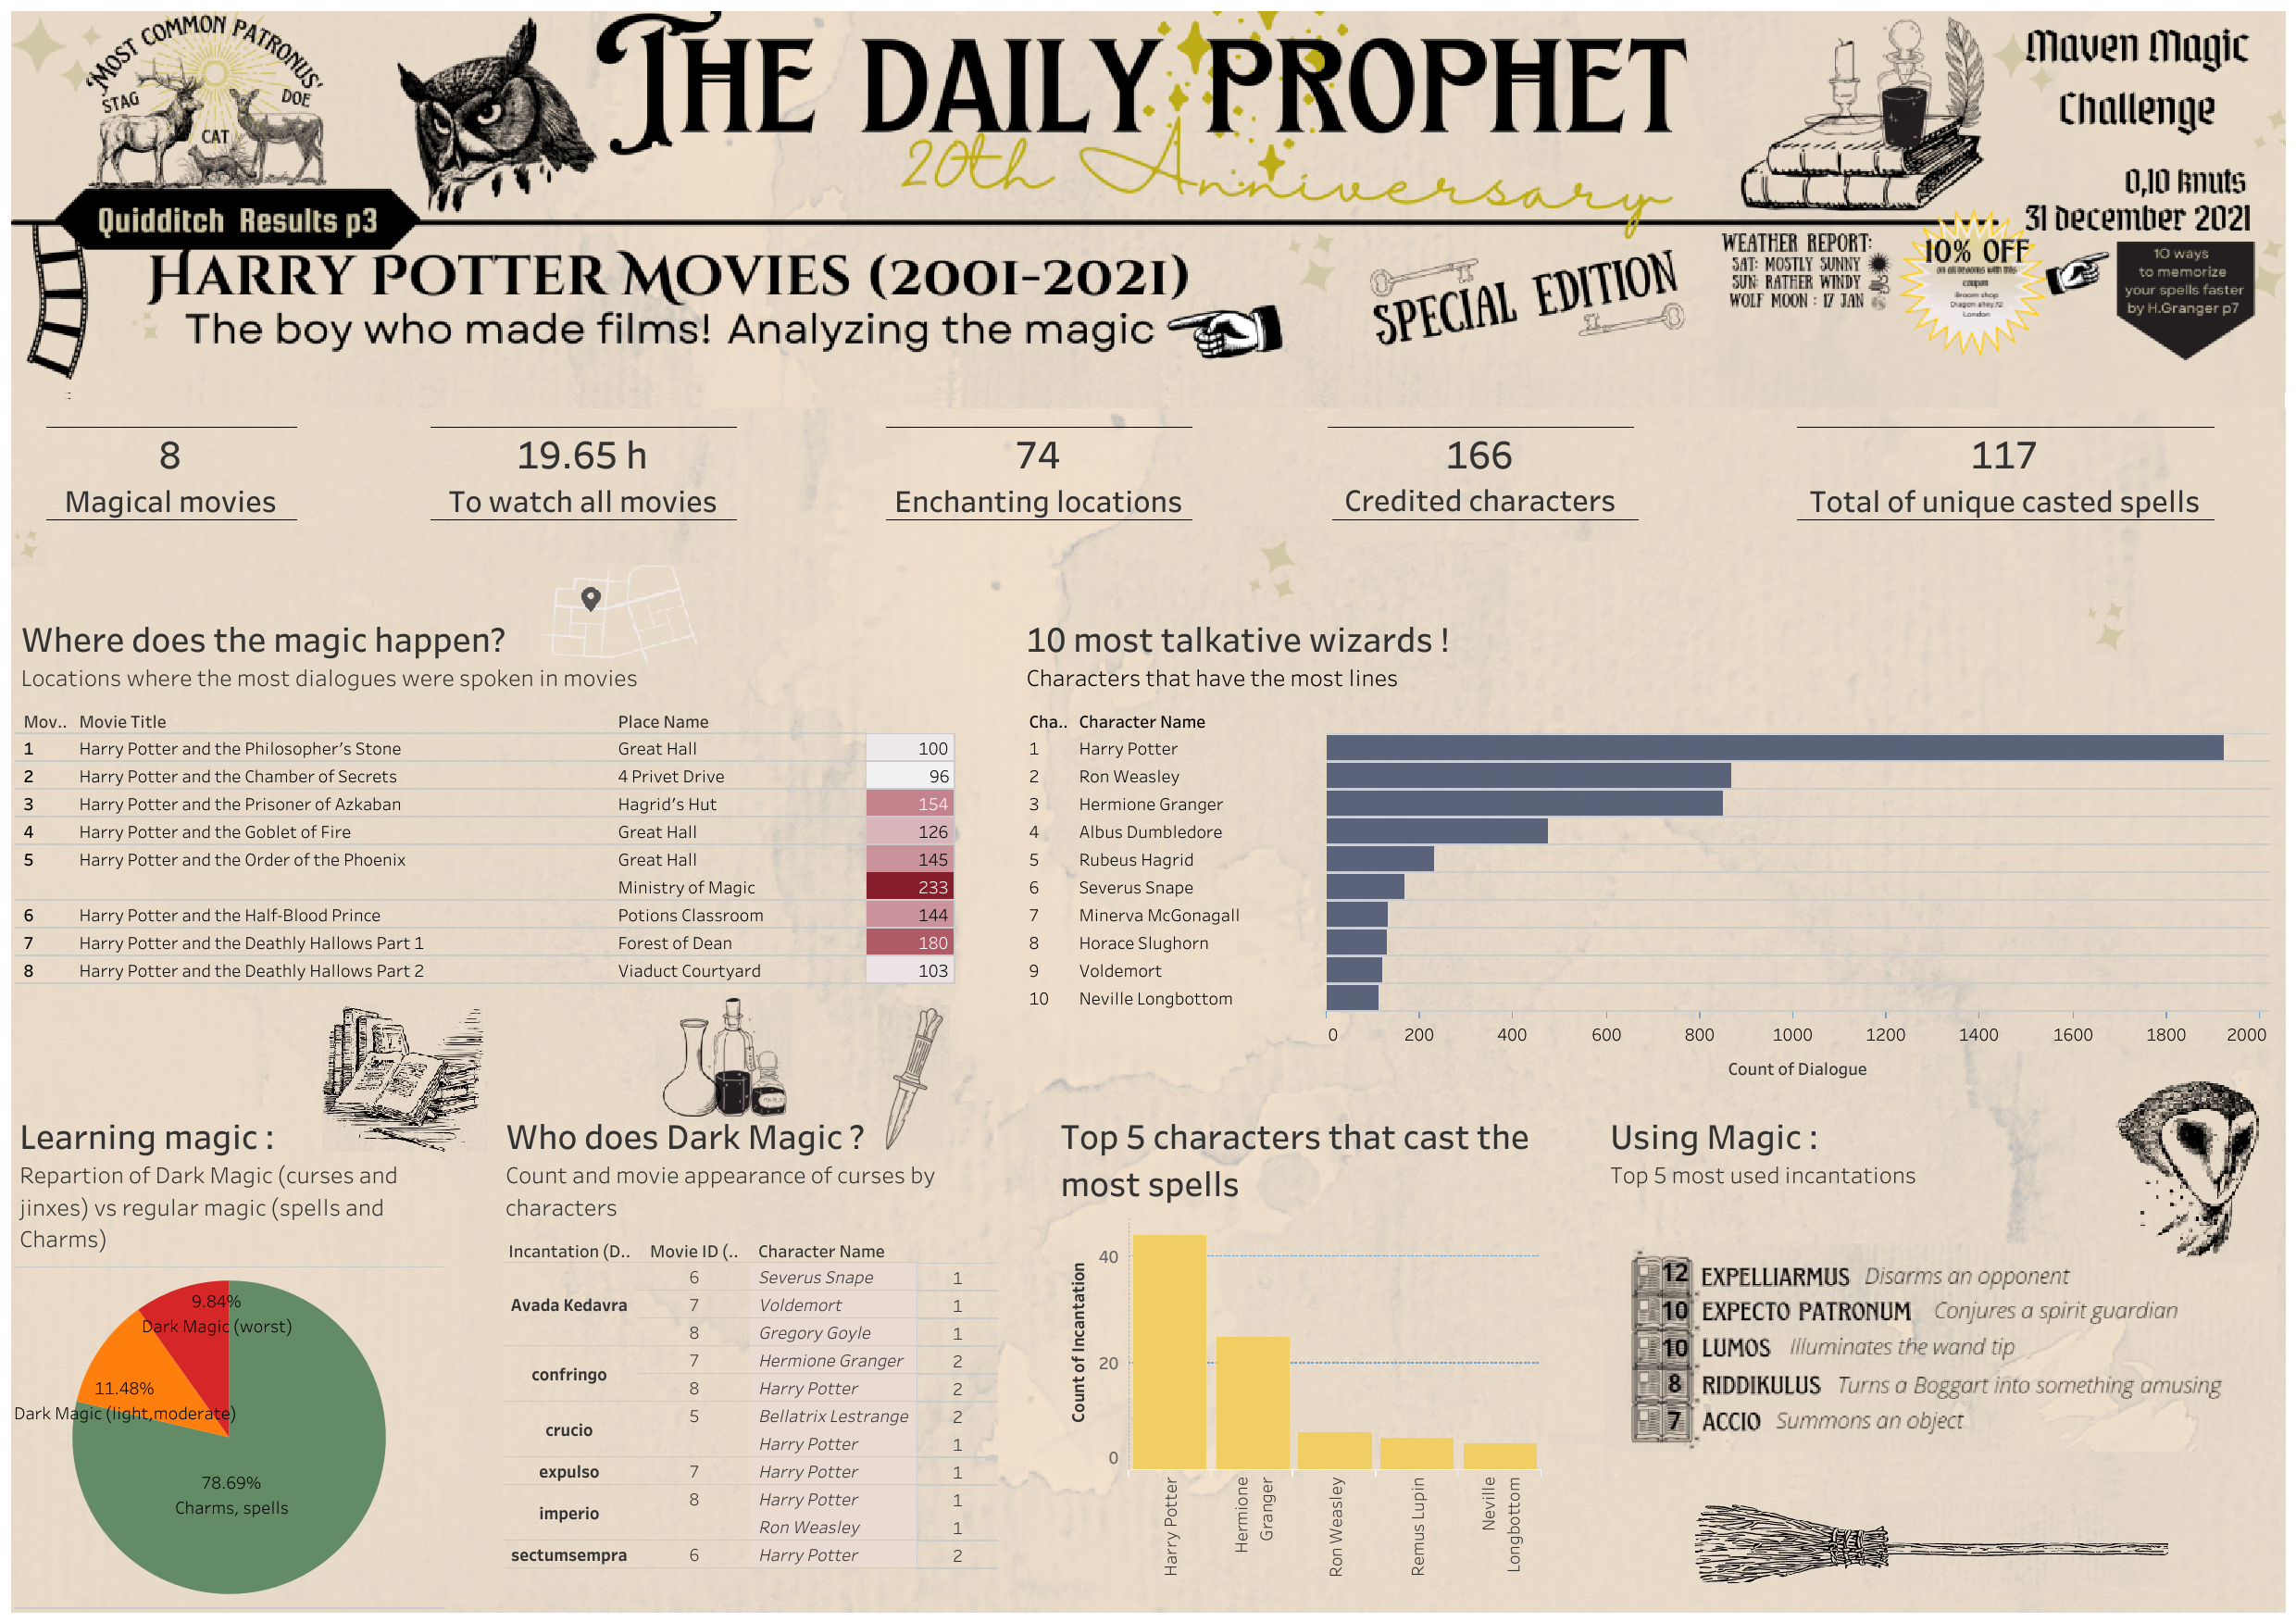 The dataset contained 6 tables (Dialogue, Chapters, Movie, Spells, Places, Characters)
Most of these tables were connected by a common ID, except for the Spells and Dialogue tables.
A little bit of work was necessary to retrieve the spells said in the dialogues. Some incantations were one word long and some were made of two words separated by a space. While the code picked up when a character was saying two spells in one line,I first just duplicated the line (keeping the same ID). Tableau wasn’t taking that duplicated line, so I had to alter the IDs by incrementing them.
The dataset contained 6 tables (Dialogue, Chapters, Movie, Spells, Places, Characters)
Most of these tables were connected by a common ID, except for the Spells and Dialogue tables.
A little bit of work was necessary to retrieve the spells said in the dialogues. Some incantations were one word long and some were made of two words separated by a space. While the code picked up when a character was saying two spells in one line,I first just duplicated the line (keeping the same ID). Tableau wasn’t taking that duplicated line, so I had to alter the IDs by incrementing them.