Analysis : Bike incidents in the US
A Data visualization project with Tableau Public - and data from Kaggle.
 (Link to Tableau Public here)
ABOUT
This project was an excercise to build a dashboard with Tableau Public that can have a real life application. It was made in one afternoon.
DATA
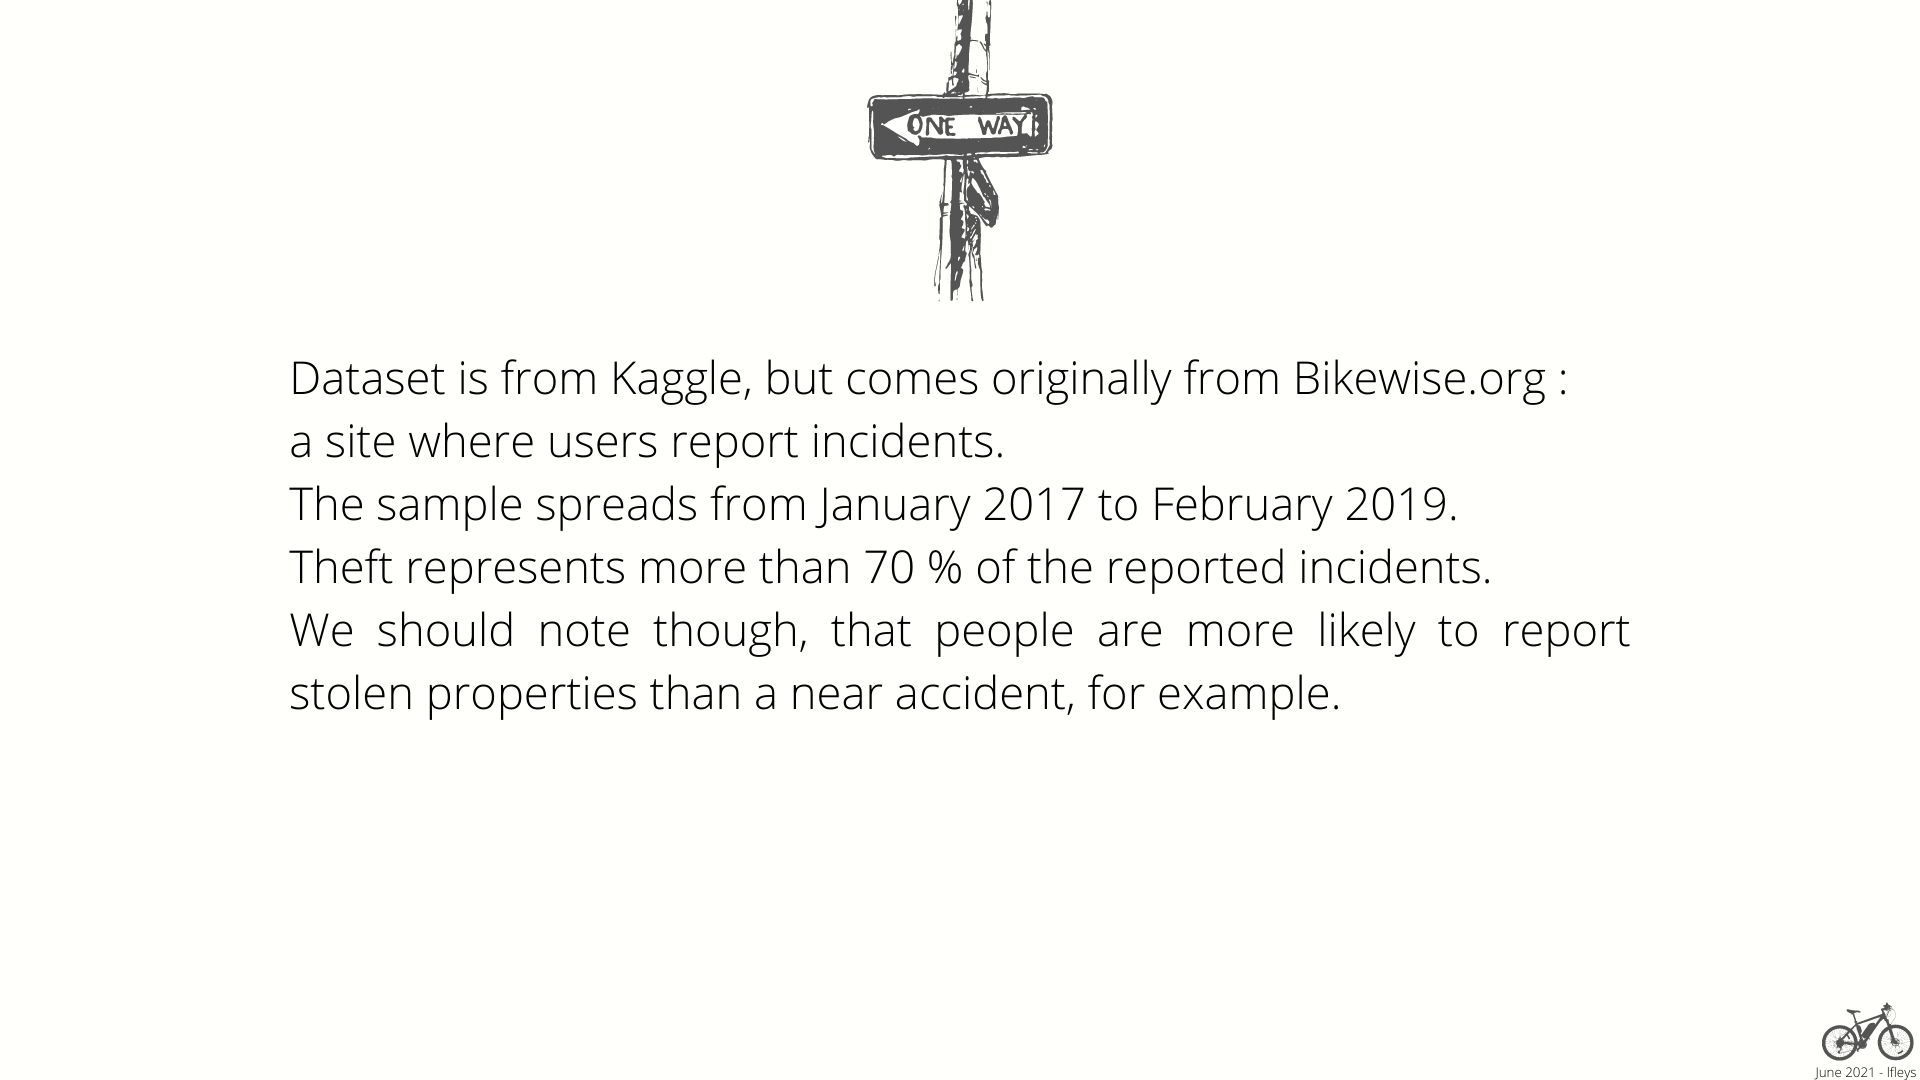
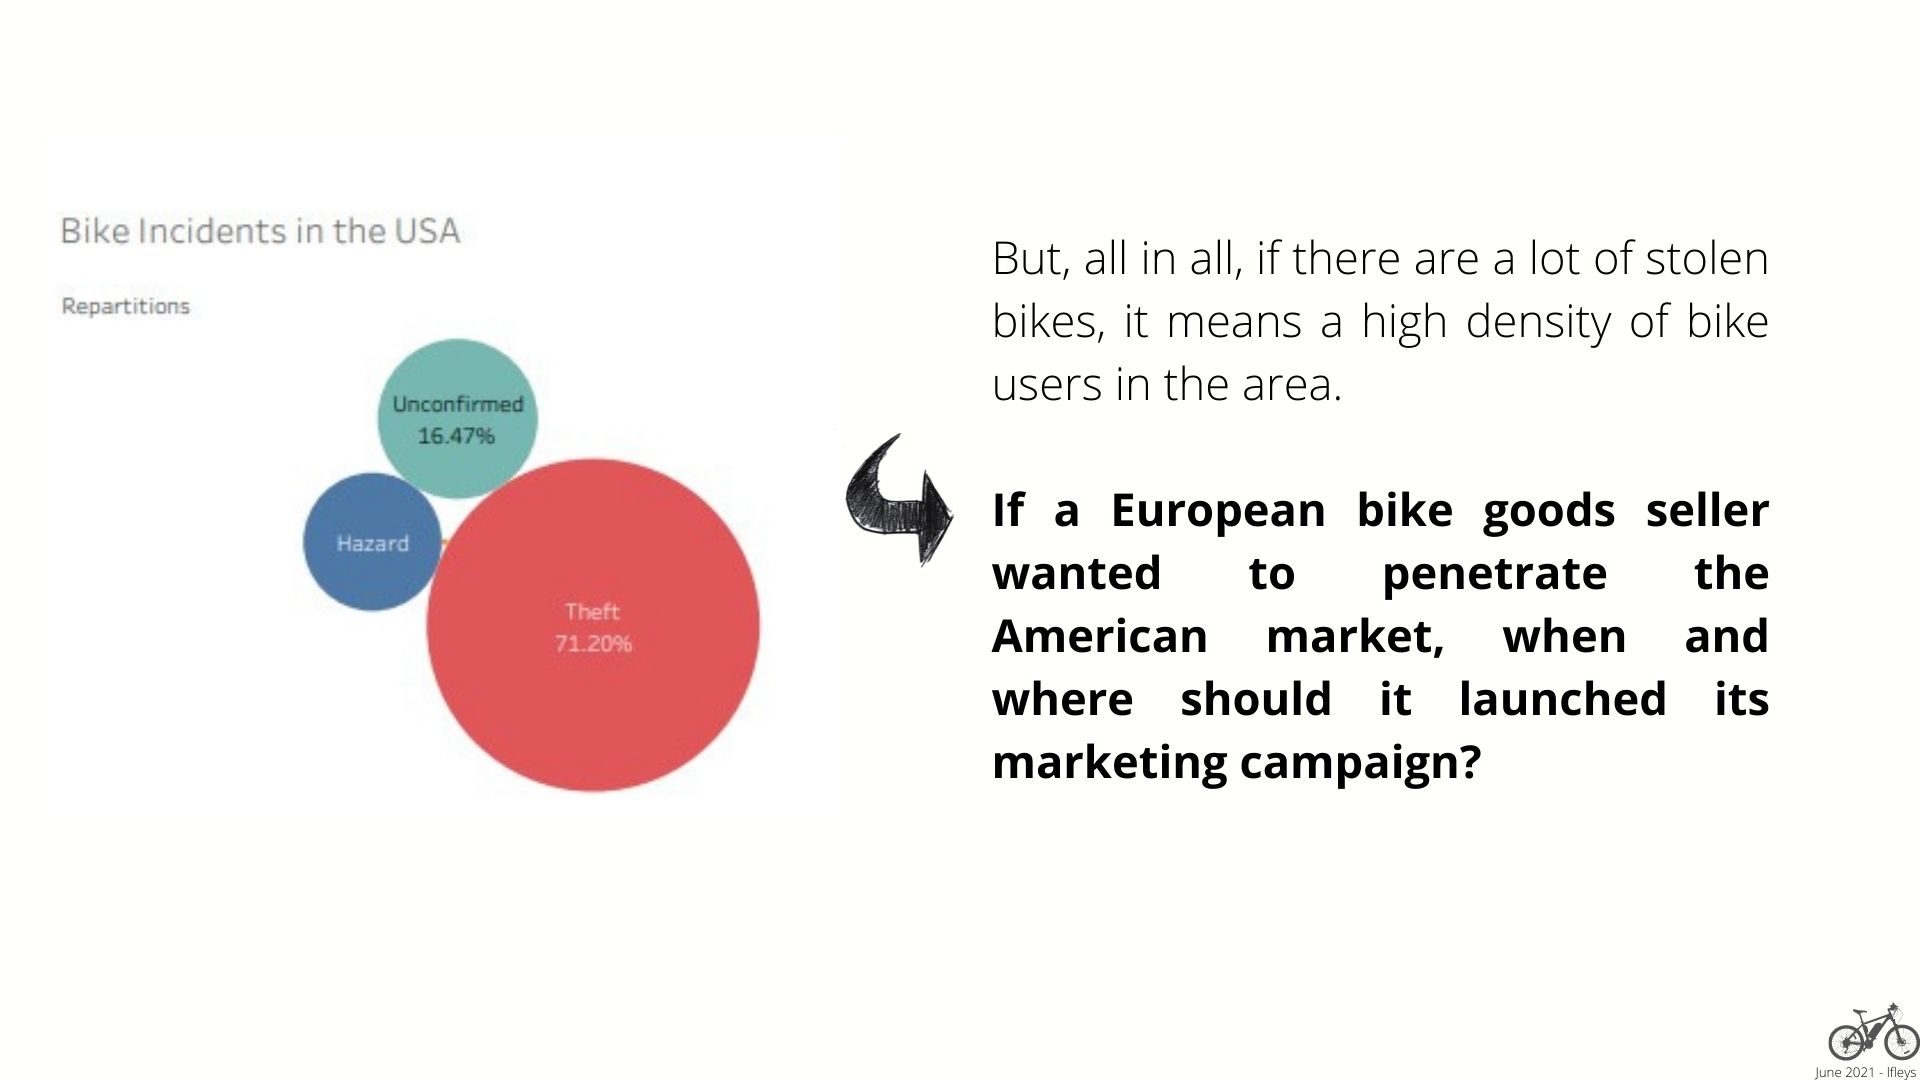
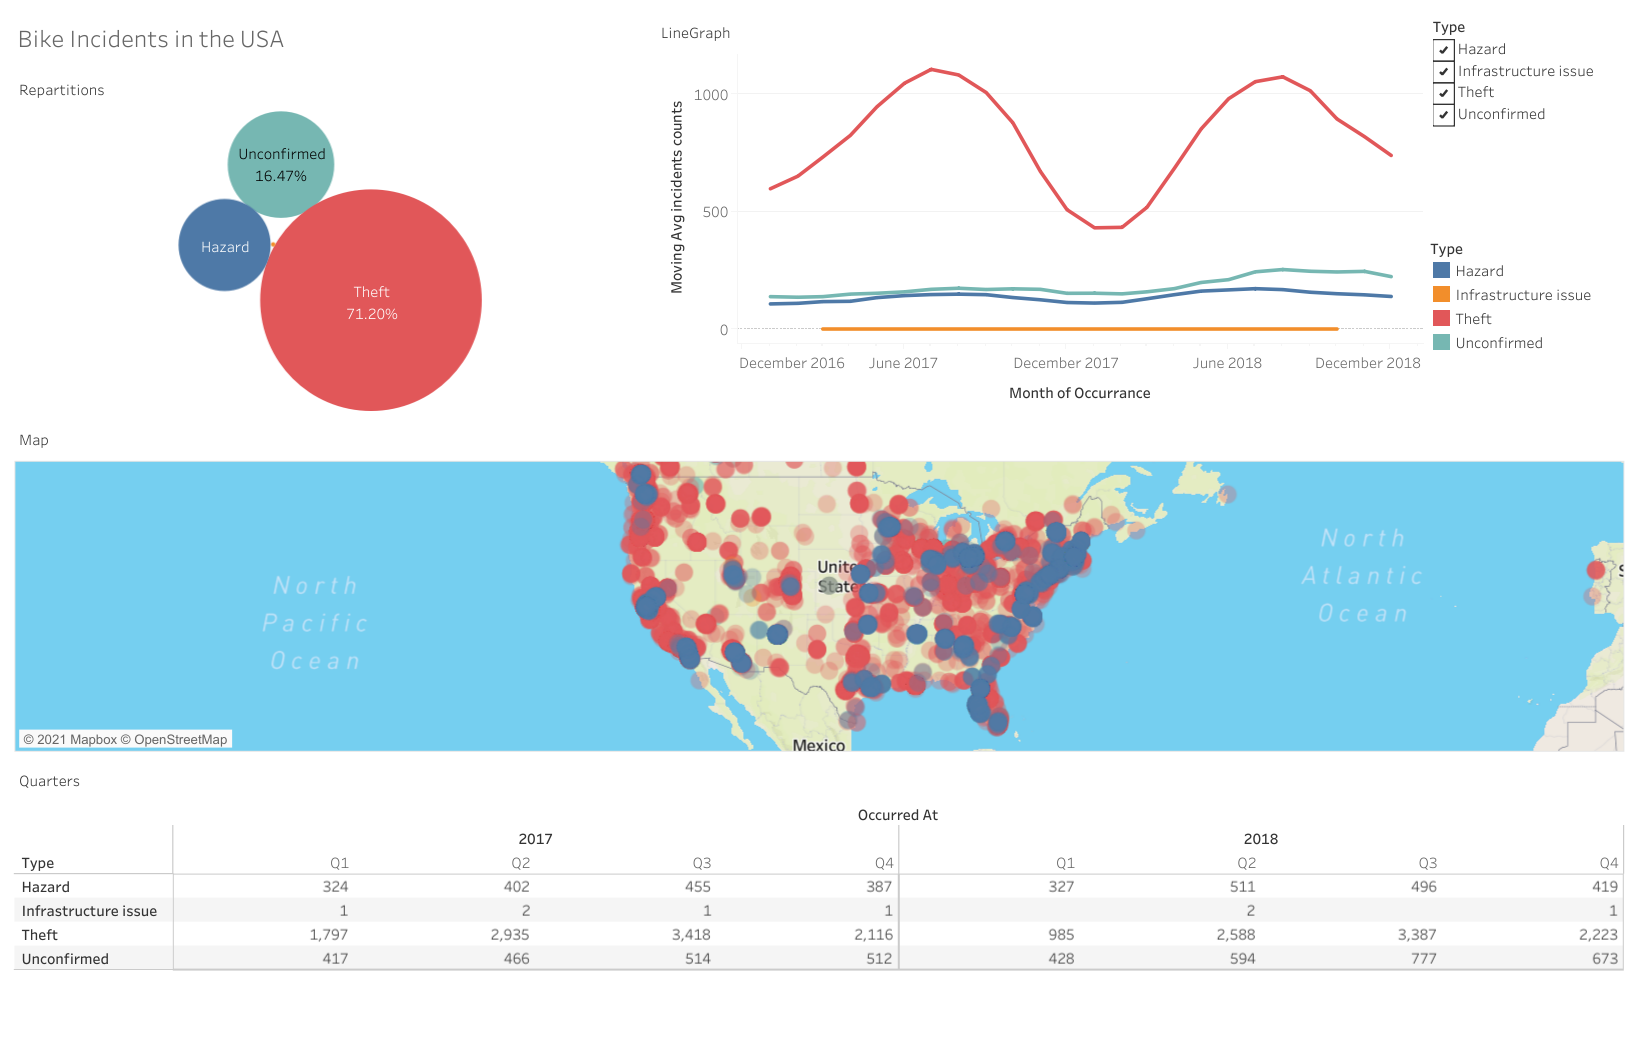
The data comes from Kaggle (link here), but is originally from Bikewise.org. A website were users self report incidents. The dataset contains the location (Latitudes and longitudes), date and time of the incident, its type, a title and a brief description.
ANALYSIS
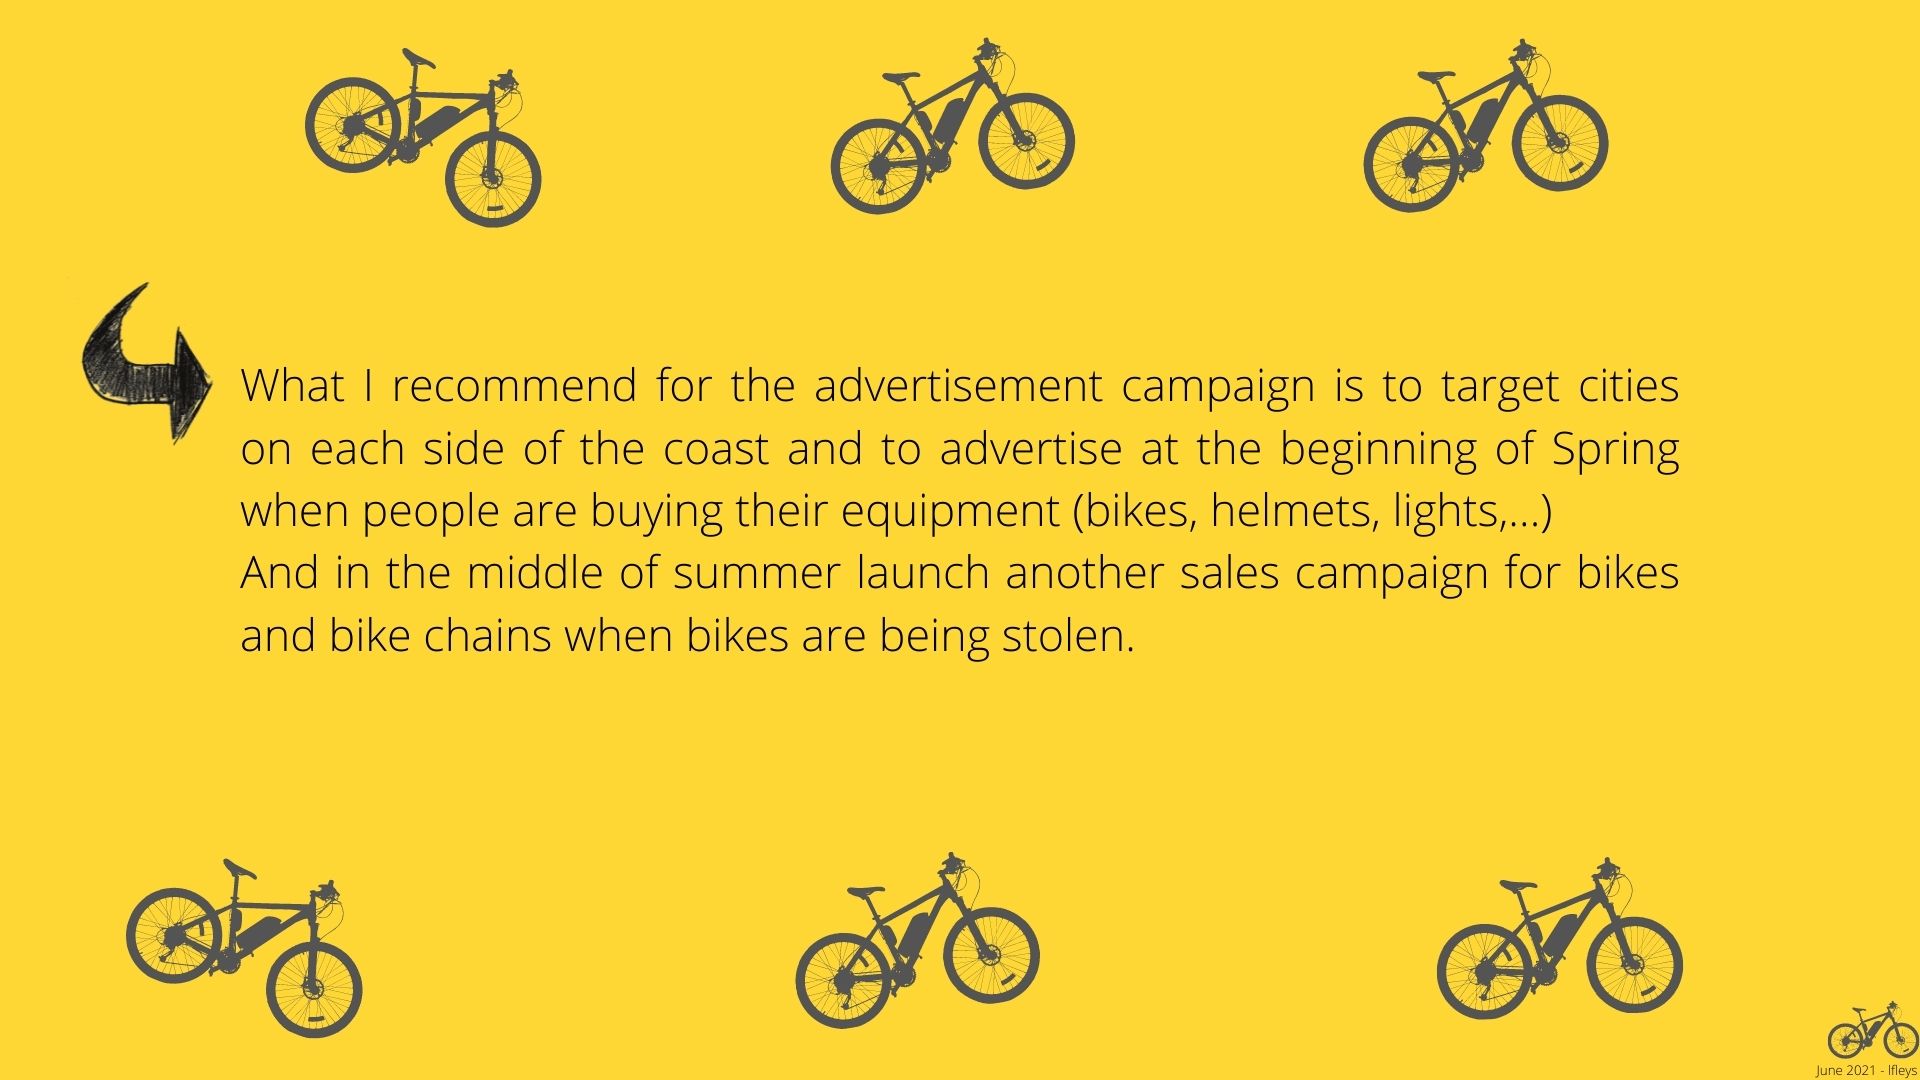
The analysis is presented below, it tries to answer the following question : “If a European bike goods seller wanted to penetrate the American market, when and where should it launched its marketing campaign?”