
Data visualizations - Playing with Tableau
A collection of dashboards made on Tableau Public to practice the principles of data visualizations and story telling.
1) Superstores : Kpi + Sales & Profit by years
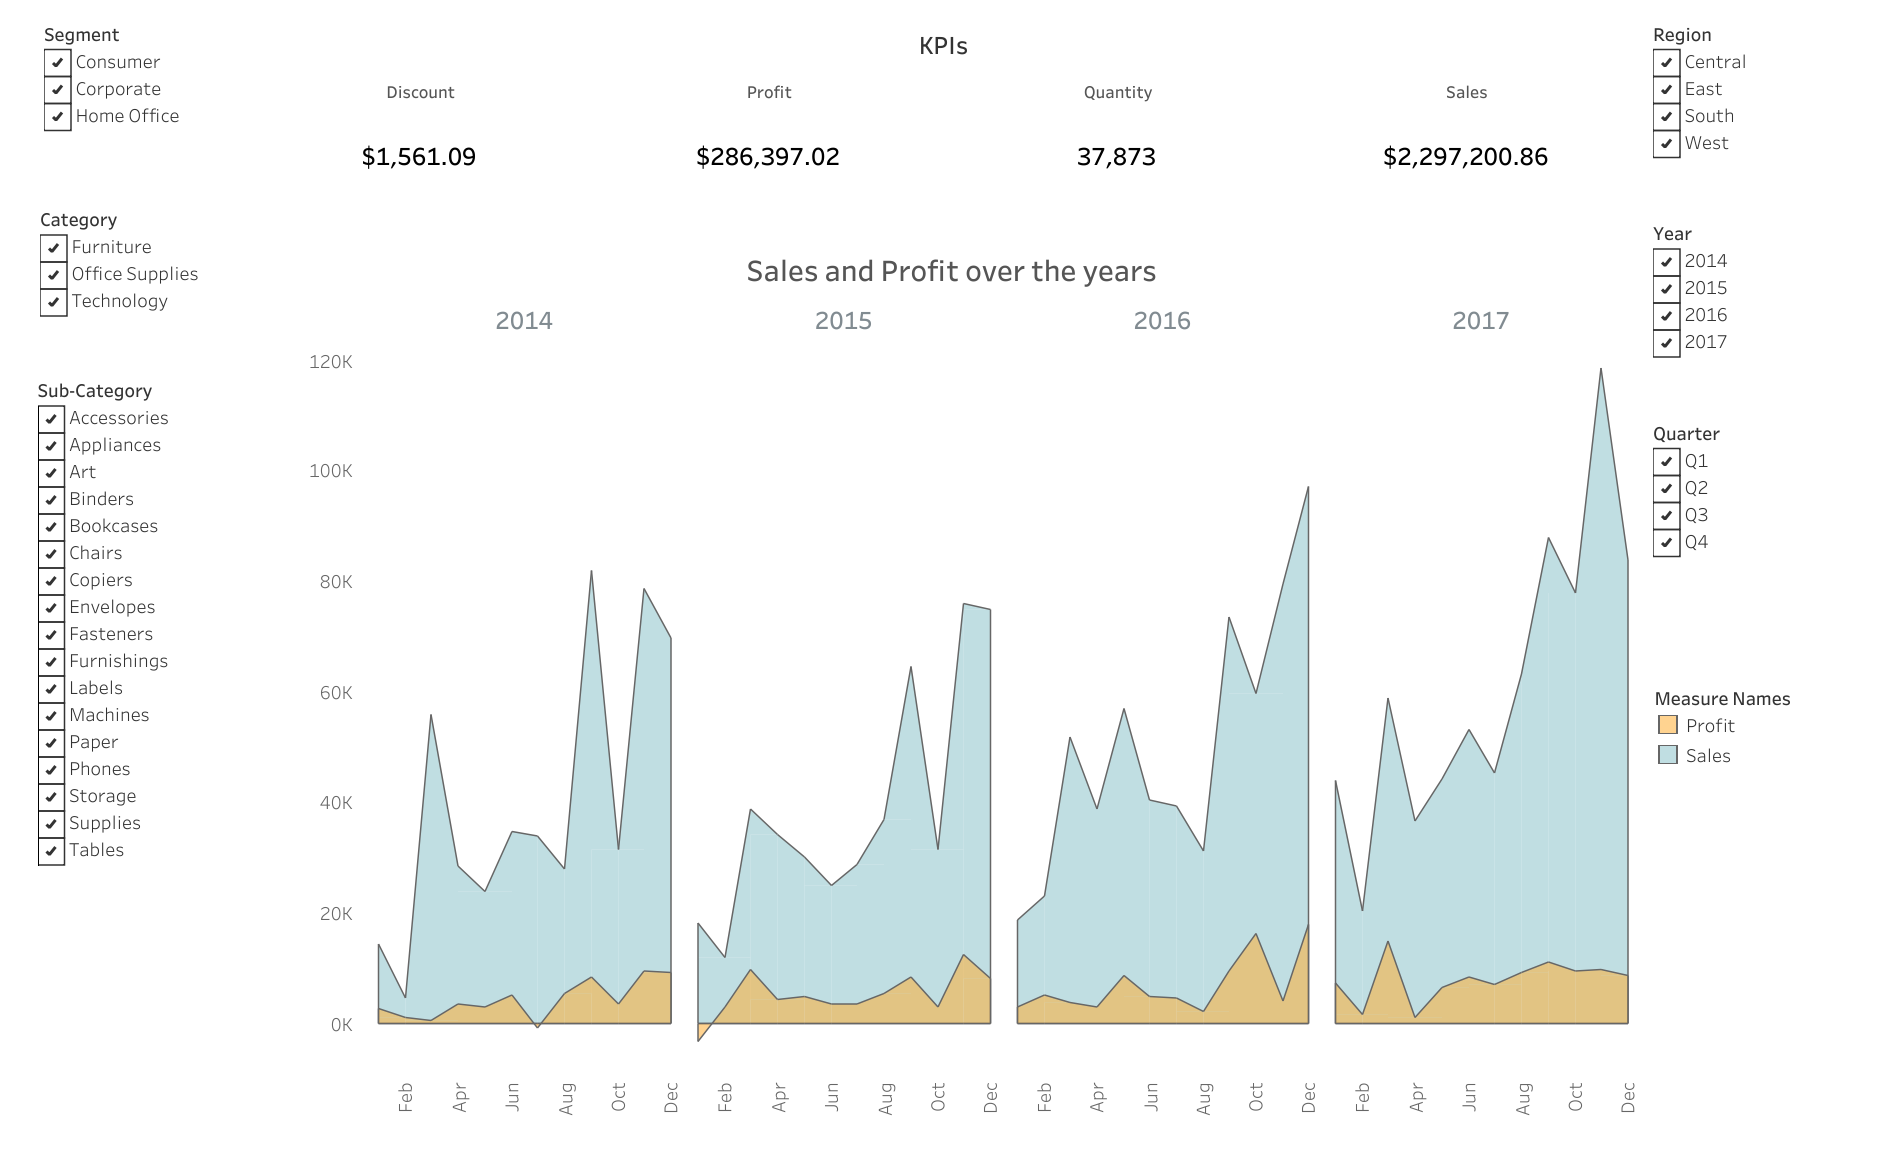
Link to Tableau Public here
2) Librairies worldwide
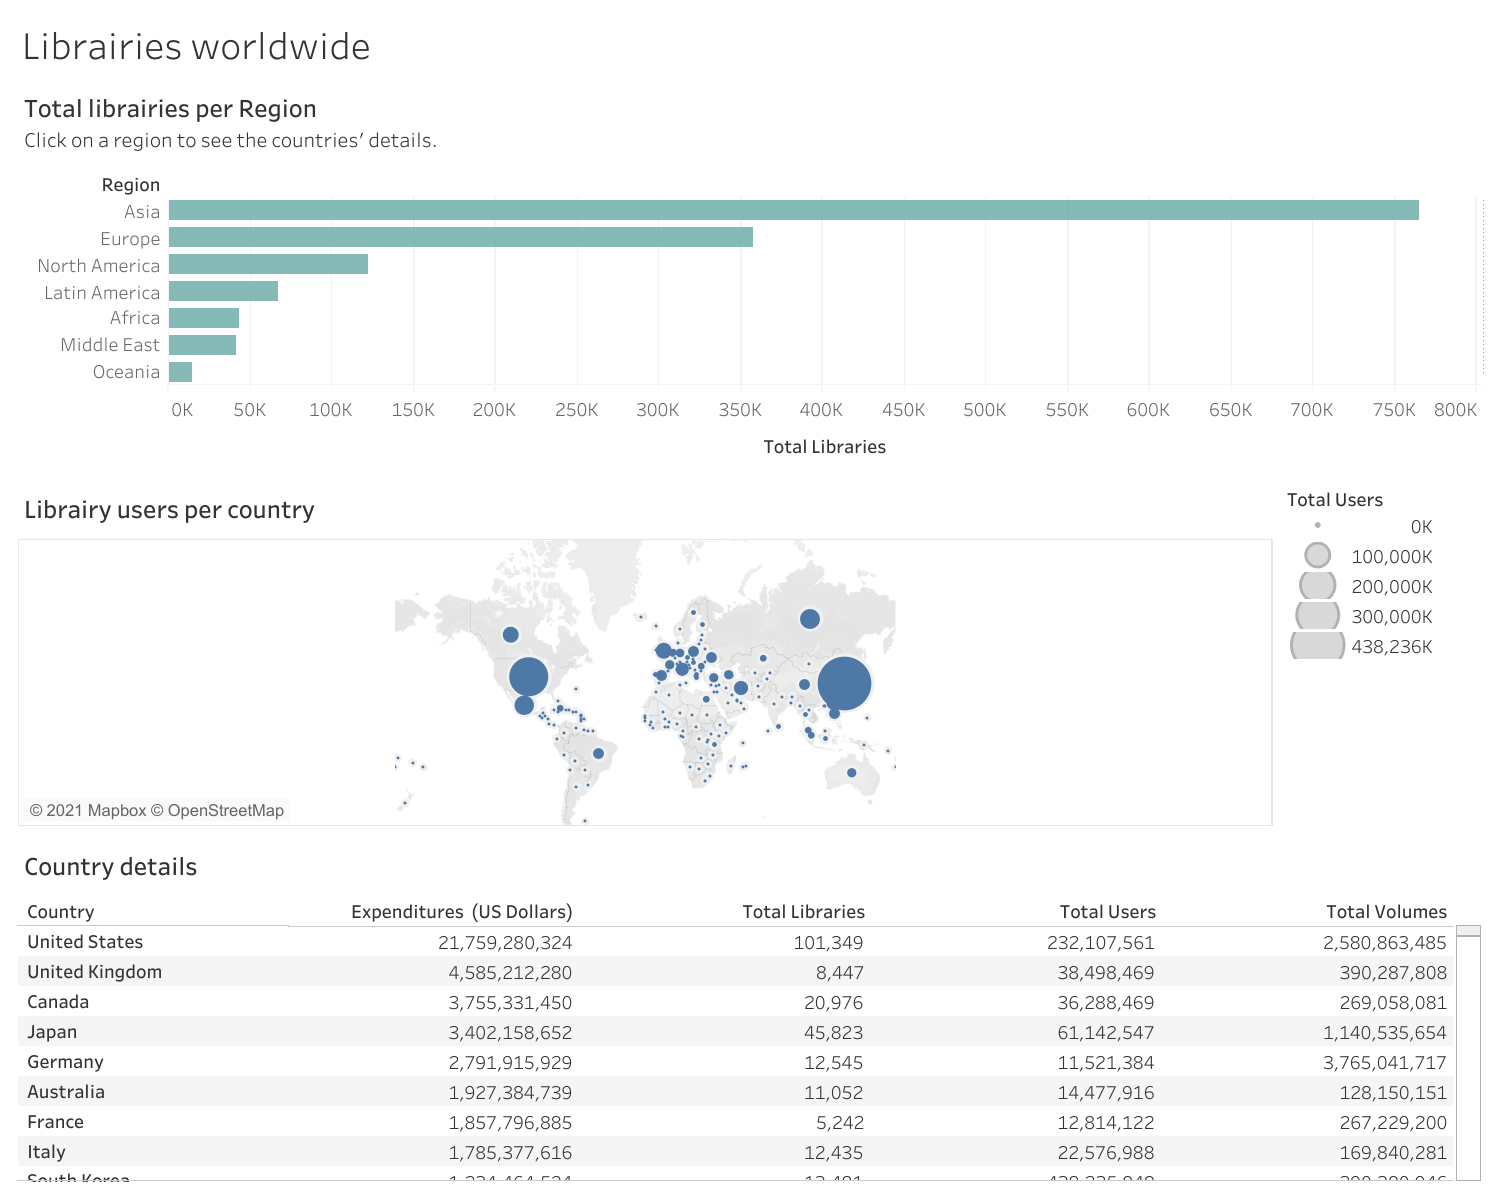
Link to Tableau Public here
3) Superstores : Sales & Orders performance per years
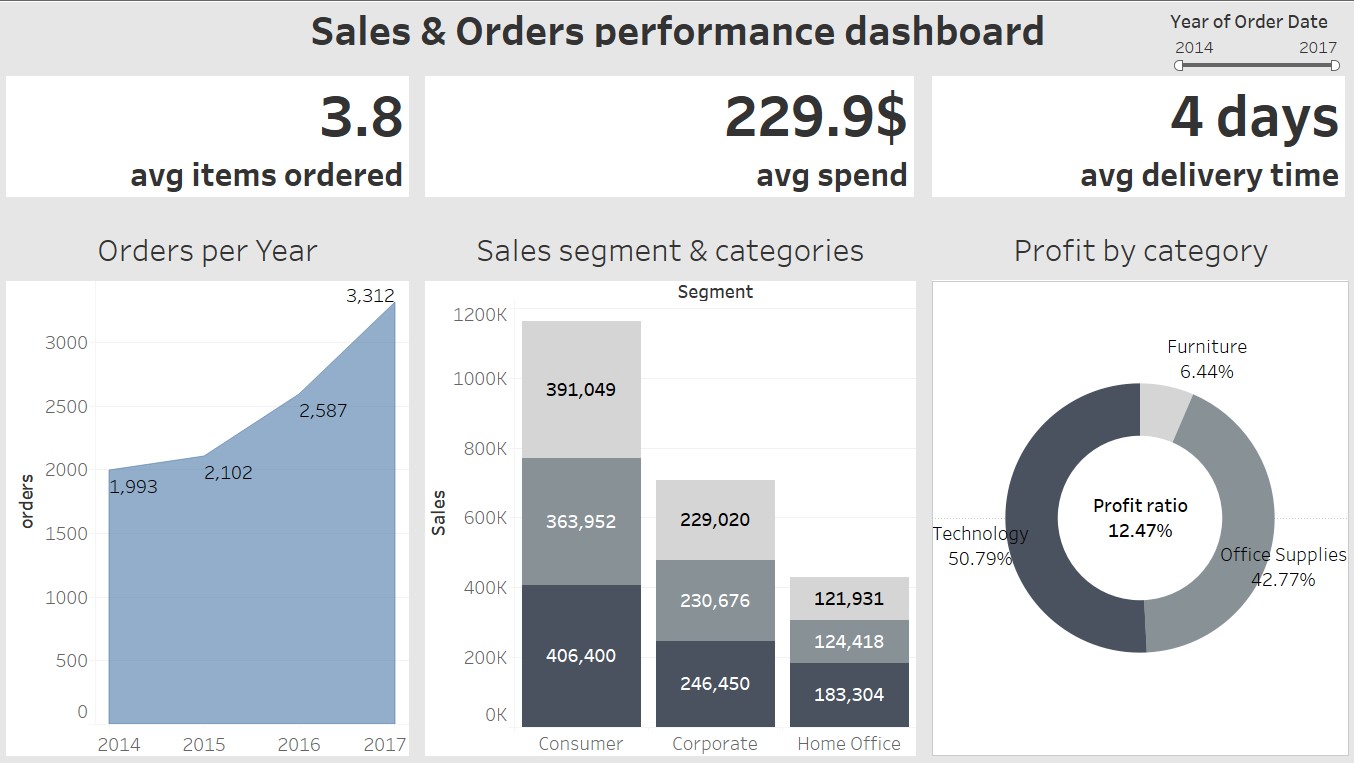
Link to Tableau Public here